 ChIP Sequencing Simulation
I. File download
| process-eland-maps.plos.pl | |
| chip-seq-simu.lib.plos.r |
II. Documentation
II.1 Genome mapping using Eland
Short Solexa sequence reads are mapped to the human reference genome using Eland, the read-mapping program distributed by Illumina with its sequencing analysis pipeline. The output generated by Eland is a tab-delimited text file, with lines that look like:
>1-1-557-760 TCTTTTATAGCTCCAAACTTTTTTTTA U0 1 0 0 2 63780267 R ..
>1-1-993-248 TTTTCTTTCTTTGTTTTTTTCTTCCTT U0 1 3 153 12 24687605 R ..
>1-1-371-674 AATTTCTCTCTGCTGAAGCTCTTCTTA U1 0 1 0 3 183334250 F .. 23G
>1-1-678-626 ACCCAGAATGCGCTGTTGATTTTTAGT U1 0 1 0 8 70748333 F .. 27G
>1-1-174-418 TGTGTCCCTTTGTAATGAATCACTATC U2 0 0 1 4 103570835 F .. 23G 24C
>1-1-105-657 TTCTAATTTGTATATTTGGACCATTTA U1 0 1 2 12 100574279 R .. 2C
- sequence name
- Sequence
- type of match
- number of exact matches found
- number of 1-error matches found
- number of 2-error matches found
(For unique best match, U, only:)
- genome file in which match was found
- position of match
- direction of match (F, forward; R, reverse)
- how N characters in read were interpreted (., not applicable; D, deletion; I, insertion)
(For U1 and U2 matches only:)
- position and type of the first substitution error
- position and type of the second substitution error
II.2 Getting tag clusters from the Eland read mapping
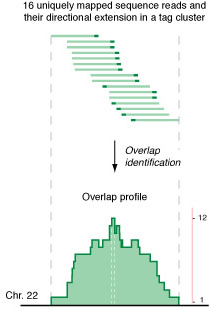
Given an Eland output file, the Perl script 'process-eland-maps.plos.pl' is used to generate the tag clusters. This script first reads in the the mapping information contained in the Eland file, extends each read to a tag with some specified length at its genomic location, then determine the overlap among the tags, and finally identifies the tag clusters.
The The command-line synopsis of this script is
process-eland-maps.plos.pl eland.out tag-length base-output-filename
The three command-line arguments are the eland output file, the tag length to which the read length is extended, and the base output file name. Suppose the Eland file chr22.eland contains the alignment information of all tags mapped to human chromosome 22 alone, the command 'process-eland-maps.plos.pl chr22.eland 174 chr22' will generate two text files: chr22_tag-clusters_orig.txt, the main output, and chr22_tag-signal_orig.wig, a signal file in the WIG format, which can be uploaded into the UCSC genome browser for a quick visual inspection. chr22_tag-clusters_orig.txt contains the information about the identified tag clusters with lines that look like:
22 5539 5712 174 1 5539 5712 174 1
22 5726 5903 178 2 5730 5899 170 2
22 7258 7431 174 1 7258 7431 174 1
22 7706 7879 174 1 7706 7879 174 1
22 8282 8566 285 3 8393 8455 63 3
The tab-delimited columns from left to right are:
- chromosome number (23 for X and 24 for Y)
- start position of the outer cluster
- end position of the outer cluster
- length of the outer cluster
- number of tags in this cluster
- start position of the inner cluster
- end position of the inner cluster
- length of the inner cluster
- height of this cluster
II.3 In silico ChIP sequencing
ChIP sequencing simulation is carried out in R. The simulation functions written in R are all stored in chip-seq-simu.lib.plos.r. To use these functions, they need to be imported into the R environment first:
> source("chip-seq-simu.lib.r");
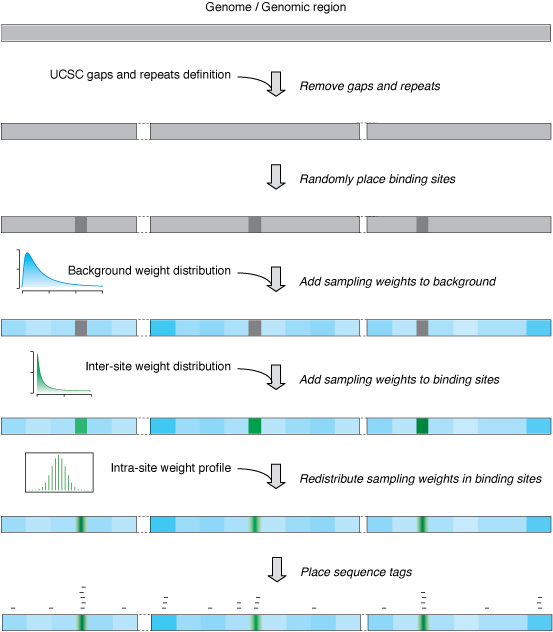
To simulate the background of ChIP sequencing with 500K reads on a 10 Mb genomic region using the uniform-background model, run the following R code:
> rgn = matrix(c(1, 1, 10000000), nrow=1);
> rgn.100.1 = place.sites(rep(100, 1), rgn);
> simulate(genome = rgn.100.1,
site.prob.increase.factors = c(1),
frgd.inter.prfls = c("unif"),
frgd.inter.prfl.pars.list = list(unif=c()),
frgd.intra.prfls = c("unif"),
bkgd.distrs = c("unif"),
bkgd.distr.pars.list = list(unif=c()),
tag.lens = rep(174, 500000),
file.name.base.start = "region-10Mb",
file.name.base.end = "simu.eland"
);
The code above will generate a eland file region-10Mb_100-1_1_unif_unif_unif_simu.eland for the simulated ChIP-seq experiment. Notice the simulation parameters are included in the file name for convenient later reference. This eland file can then be processed by process-eland-maps.plos.pl as described above.
To simulate both the binding sites and the background of ChIP sequencing with 500K reads on a 10 Mb genomic region with 100 500-bp binding sites using the varying-site (power-law distribution with increasing factor=2) and the varying-background (gamma distribution with shape=2 and scale=20) model, run the following R code:
> rgn = matrix(c(1, 1, 10000000), nrow=1);
> rgn.500.100 = place.sites(rep(500, 100), rgn);
> simulate(genome = rgn.500.100,
site.prob.increase.factors = c(10),
frgd.inter.prfls = c("powerlaw"),
frgd.inter.prfl.pars.list = list(powerlaw=c(2)),
frgd.intra.prfls = c("tri"),
bkgd.distrs = c("gamma"),
bkgd.distr.pars.list = list(gamma=c(1,20)),
tag.lens = rep(174, 500000),
file.name.base.start = "region-10Mb",
file.name.base.end = "simu.eland"
);
The code above will generate a eland file region-10Mb_500-100_10_powerlaw-2_tri_gamma-1-20_simu.eland for the simulated ChIP-seq experiment.